Sleep Event Detection#
This notebook demonstrates how to use Sleep-Semantic-Segmentation to perform single-channel sleep event detection. It also shows a step-by-step description of the detection algorithm. Please make sure to install the latest version of Sleep-Semantic-Segmentation first by typing the following line in your terminal or command prompt: pip install --upgrade wrap_sssm
[46]:
import mne
import yasa
import os
import numpy as np
import matplotlib.pyplot as plt
import seaborn as sns
from wrap_sssm.detection.detection import sleep_event_detect
sns.set(font_scale=1)
%matplotlib inline
Loading data#
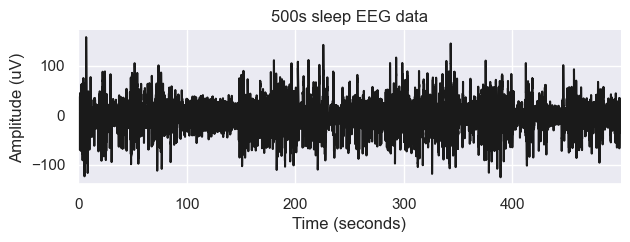
As an example, we load sleep on a 500s single channel EEG data. The sampling rate is 100 Hz.
[47]:
raw = mne.io.read_raw_edf('../../../notebookes/SC4001E0-PSG.edf', preload=True)
Extracting EDF parameters from D:\code_cloud\new_eeg_deep\scut_eeg_dl\wrap_sssm\notebookes\SC4001E0-PSG.edf...
EDF file detected
Setting channel info structure...
Creating raw.info structure...
Reading 0 ... 7949999  =      0.000 ... 79499.990 secs...
Preprocessing#
[48]:
raw.filter(0.1, 40)
data = raw.get_data(['EEG Fpz-Cz'], units="uV")
sf = 100
data = data[:,:50000]
Filtering raw data in 1 contiguous segment
Setting up band-pass filter from 0.1 - 40 Hz

FIR filter parameters
---------------------
Designing a one-pass, zero-phase, non-causal bandpass filter:
- Windowed time-domain design (firwin) method
- Hamming window with 0.0194 passband ripple and 53 dB stopband attenuation
- Lower passband edge: 0.10
- Lower transition bandwidth: 0.10 Hz (-6 dB cutoff frequency: 0.05 Hz)
- Upper passband edge: 40.00 Hz
- Upper transition bandwidth: 10.00 Hz (-6 dB cutoff frequency: 45.00 Hz)
- Filter length: 3301 samples (33.010 s)
[Parallel(n_jobs=1)]: Using backend SequentialBackend with 1 concurrent workers.
[Parallel(n_jobs=1)]: Done   1 out of   1 | elapsed:    0.1s remaining:    0.0s
[Parallel(n_jobs=1)]: Done   2 out of   2 | elapsed:    0.3s remaining:    0.0s
[Parallel(n_jobs=1)]: Done   3 out of   3 | elapsed:    0.5s remaining:    0.0s
[Parallel(n_jobs=1)]: Done   4 out of   4 | elapsed:    0.7s remaining:    0.0s
[Parallel(n_jobs=1)]: Done   7 out of   7 | elapsed:    1.3s finished
[49]:
# Define sampling frequency and time vector
times = np.arange(data.shape[-1]) / sf

# Plot the signal
fig, ax = plt.subplots(1, 1, figsize=(7, 2))
plt.plot(times, data[0,:], lw=1.5, color='k')
plt.xlabel('Time (seconds)')
plt.ylabel('Amplitude (uV)')
plt.xlim([times.min(), times.max()])
plt.title('500s sleep EEG data')
sns.despine()
detect sleep event#
Let’s try to detect these two spindles using the wrap_sssm.detection.detection.sleep_event_detect function. Here’ we’re using a minimal example, but there are many other optional arguments that you can pass to this function.
[50]:
# Apply the detection using sss sleep_event_detect
sp = sleep_event_detect(data, sf)
[ ]:
# Display the results using .summary()
sp.summary()
Hooray! The algorithm successfully identified the two spindles!
The output of the spindles detection is a SleepEventDetect class, which comes with some pre-compiled functions (also called methods). For instance, the summary method returns a [dict] contained pandas DataFrame with all the detected sleep event and their properties.
[51]:
sp.summary('Sawtooth')
[Parallel(n_jobs=1)]: Using backend SequentialBackend with 1 concurrent workers.
[Parallel(n_jobs=1)]: Done   1 out of   1 | elapsed:    0.0s remaining:    0.0s
[Parallel(n_jobs=1)]: Done   1 out of   1 | elapsed:    0.0s finished
[Parallel(n_jobs=1)]: Using backend SequentialBackend with 1 concurrent workers.
[Parallel(n_jobs=1)]: Done   1 out of   1 | elapsed:    0.0s remaining:    0.0s
[Parallel(n_jobs=1)]: Done   1 out of   1 | elapsed:    0.0s finished
C:\software\Anaconda\envs\py3.9\lib\site-packages\wrap_sssm\detection\detection.py:410: SettingWithCopyWarning:
A value is trying to be set on a copy of a slice from a DataFrame

See the caveats in the documentation: https://pandas.pydata.org/pandas-docs/stable/user_guide/indexing.html#returning-a-view-versus-a-copy
  data_df.loc[index, "Peak"] = sp_pro
[Parallel(n_jobs=1)]: Using backend SequentialBackend with 1 concurrent workers.
[Parallel(n_jobs=1)]: Done   1 out of   1 | elapsed:    0.0s remaining:    0.0s
[Parallel(n_jobs=1)]: Done   1 out of   1 | elapsed:    0.0s finished
19-Jul-24 08:32:34 | WARNING | no neg_peaks or pos_peaks
19-Jul-24 08:32:34 | WARNING | no neg_peaks or pos_peaks
19-Jul-24 08:32:34 | WARNING | no neg_peaks or pos_peaks
19-Jul-24 08:32:34 | WARNING | no neg_peaks or pos_peaks
19-Jul-24 08:32:34 | WARNING | no neg_peaks or pos_peaks
19-Jul-24 08:32:34 | WARNING | no neg_peaks or pos_peaks
19-Jul-24 08:32:34 | WARNING | no neg_peaks or pos_peaks
19-Jul-24 08:32:34 | WARNING | no neg_peaks or pos_peaks
19-Jul-24 08:32:34 | WARNING | no neg_peaks or pos_peaks
19-Jul-24 08:32:34 | WARNING | no neg_peaks or pos_peaks
19-Jul-24 08:32:34 | WARNING | no neg_peaks or pos_peaks
19-Jul-24 08:32:34 | WARNING | no neg_peaks or pos_peaks
19-Jul-24 08:32:34 | WARNING | no neg_peaks or pos_peaks
19-Jul-24 08:32:34 | WARNING | no neg_peaks or pos_peaks
19-Jul-24 08:32:34 | WARNING | no neg_peaks or pos_peaks
19-Jul-24 08:32:34 | WARNING | no neg_peaks or pos_peaks
19-Jul-24 08:32:34 | WARNING | no neg_peaks or pos_peaks
19-Jul-24 08:32:34 | WARNING | no neg_peaks or pos_peaks
19-Jul-24 08:32:34 | WARNING | no neg_peaks or pos_peaks
19-Jul-24 08:32:34 | WARNING | no neg_peaks or pos_peaks
19-Jul-24 08:32:34 | WARNING | no neg_peaks or pos_peaks
19-Jul-24 08:32:34 | WARNING | no neg_peaks or pos_peaks
19-Jul-24 08:32:34 | WARNING | no neg_peaks or pos_peaks
19-Jul-24 08:32:34 | WARNING | no neg_peaks or pos_peaks
19-Jul-24 08:32:34 | WARNING | no neg_peaks or pos_peaks
19-Jul-24 08:32:34 | WARNING | no neg_peaks or pos_peaks
19-Jul-24 08:32:34 | WARNING | no neg_peaks or pos_peaks
19-Jul-24 08:32:34 | WARNING | no neg_peaks or pos_peaks
19-Jul-24 08:32:34 | WARNING | no neg_peaks or pos_peaks
19-Jul-24 08:32:34 | WARNING | no neg_peaks or pos_peaks
19-Jul-24 08:32:34 | WARNING | no neg_peaks or pos_peaks
19-Jul-24 08:32:34 | WARNING | no neg_peaks or pos_peaks
19-Jul-24 08:32:34 | WARNING | no neg_peaks or pos_peaks
[51]:
| Start | End | Duration | label | predict_proba | epoch_id | |
|---|---|---|---|---|---|---|
| 42 | 12025 | 12175 | 150 | Sawtooth | 0.683544 | 0 |
| 46 | 13375 | 13475 | 100 | Sawtooth | 0.696941 | 0 |
| 48 | 13975 | 14275 | 300 | Sawtooth | 0.745709 | 0 |
Plot an overlay of our detected events#
Event_type is a list, select different sleep events, different detected events could be plot on the data. plot_detection
[54]:
%matplotlib widget
sp.plot_detection(event_type=['Sawtooth'],figsize=(5, 4))
[54]:
<function wrap_sssm.detection.detection.SleepEventDetect.plot_detection.<locals>.update(epoch, amplitude, win_size)>
Plot average of detected events#
Event_type is a list, select different sleep events, different detected events could be plot. plot_average
[53]:
figure = sp.plot_average(event_type=['Sawtooth'],figsize=(5, 3))
plt.show()
Logging#
SSS uses the logging module to selectively print relevant messages. The default level of the logger is set to “WARNING”, which means that a message will only be displayed if a warning occurs. However, you can easily set this parameter to “INFO” to get some relevant infos about the detection pipeline and the data.
This can be useful to debug the detection and/or if you feel that the detection is not working well on your data.
[ ]:
sp = sleep_event_detect(data, sf,verbose='info')
sp.summary()
Execution time#
The total execution time on a regular laptop is 10-20 ms per 15 seconds of data sampled at 100 Hz. Scaled to a full night recording, the computation time should not exceed 5-10 seconds per channel on any modern computers. Furthermore, it is possible to disable one or more threshold and thus speed up the computation. Note that most of the computation cost is dominated by the bandpass filter(s).